GET IN TOUCH
Reach Out to Us
Whether you are a farmer setting up fields, a trader tracking mandi rates, or an enterprise partner interested in our price intelligence suite, we would love to hear from you.
From satellite to sale: intelligence for every acre.
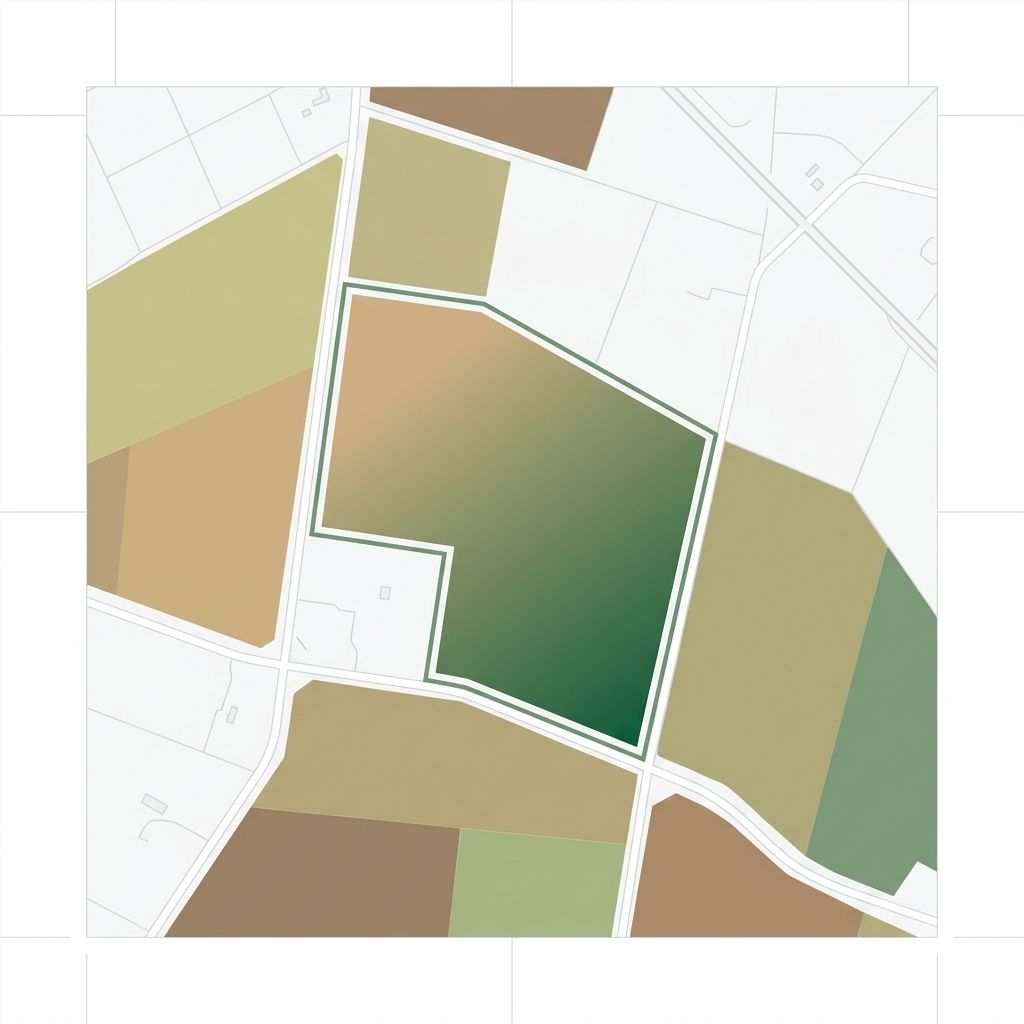
Define your farm field boundary with our simple, precise drawing tool. Our system automatically registers the exact acreage, maps geographic coordinate centroids, and establishes Sentinel satellite tracking feeds instantly to initialize historical canopy and weather intelligence.
Monitor plant health and vigor in high-resolution using NDVI indices. By parsing multi-spectral bands, our platform generates detailed crop density maps, helping you easily identify crop stress zones, nutrient deficiencies, or weed patches before they affect yield.
Go beyond simple greenness with seven distinct agricultural indices. Access advanced canopy datasets including NDRE for late-stage nitrogen density, MSAVI for early-stage seedling detection on bare soils, and EVI for dense crop canopy penetration, ensuring complete lifecycle crop insight.
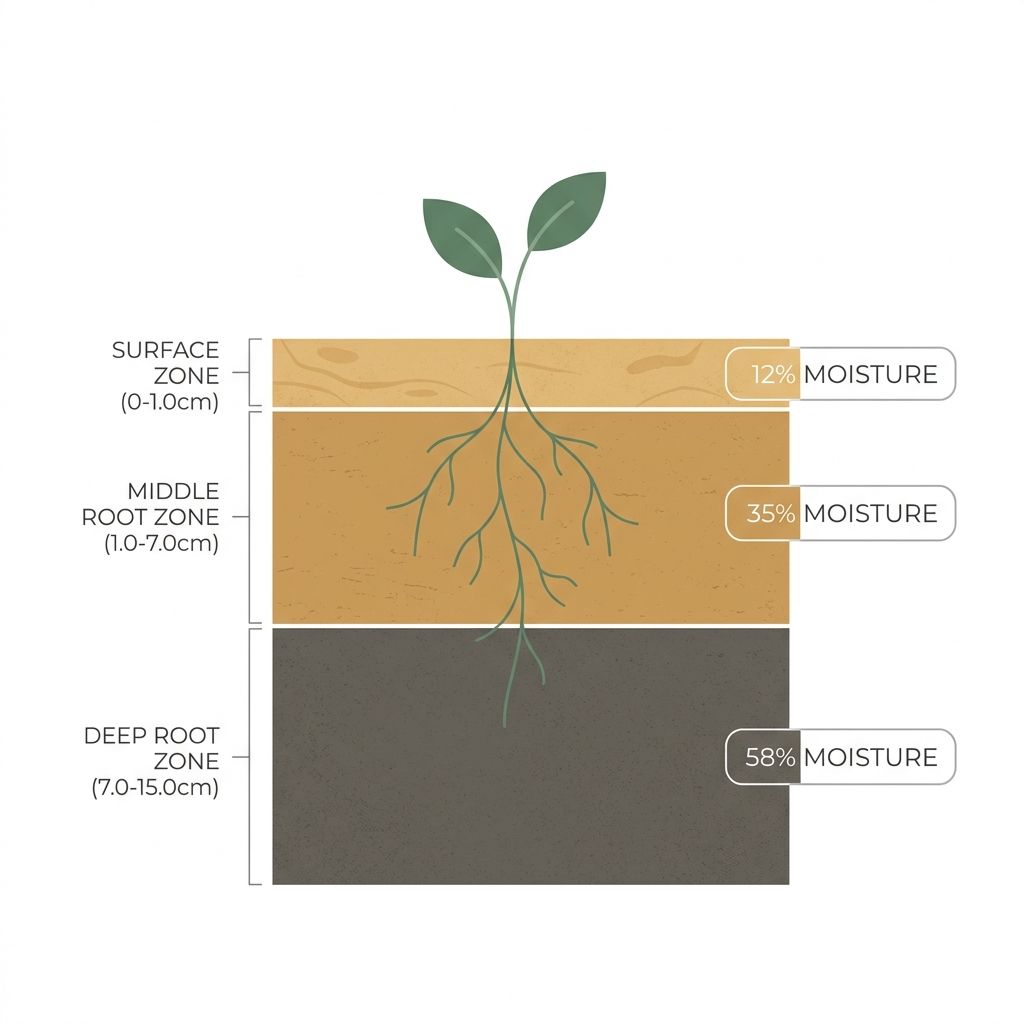
Track soil moisture and temperature profiles across three critical root layers: Surface (0–1cm) for seedbed monitoring, Active Root Zone (3–9cm) for crop hydration extraction, and Deep Root Zone (9–27cm) for deep ground reserves, preventing under-watering stress.
Optimize irrigation schedules using calculated water balance advisories. Our engine combines real-time daily reference evapotranspiration (ET₀), historical precipitation, and soil zone capacity metrics to forecast crop water requirements, helping you prevent runoff waste.
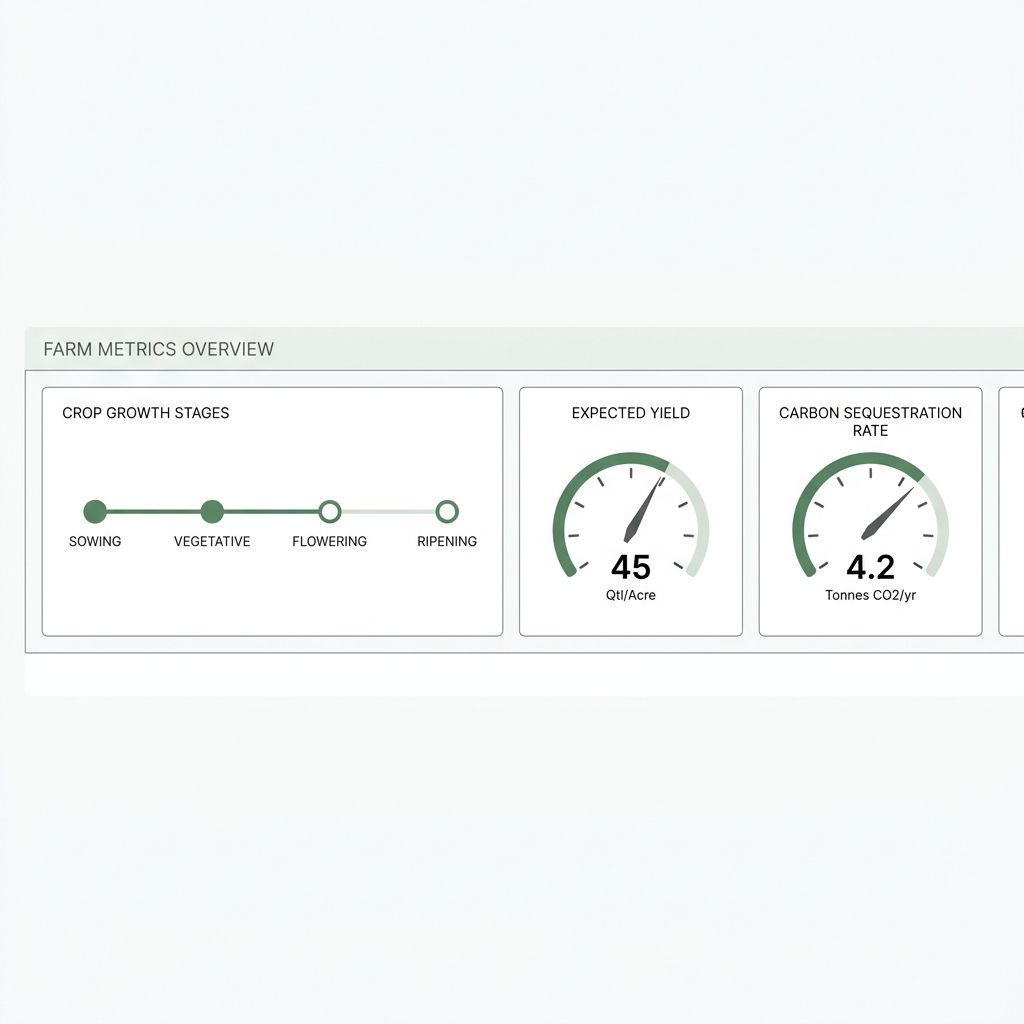
View Weather & Soil DetailsMonitor the physiological development of your crop across 8 specialized growth stages. From germination and vegetative expansion to flowering and maturity, our models align satellite NDVI curves with temperature trends to track exactly where your crop stands.
Estimate harvest tonnage early with deterministic yield forecasting models. By cross-referencing cumulative growing degree days (GDD), regional microclimate indexes, and active canopy vegetation curves, the platform runs predictive simulations to estimate crop yield potentials.
Measure the environmental impact of your farm with organic carbon sequestration tracking. Our models estimate net carbon capture rates in crop biomass, organic plant matter, and deep soil zones over the complete seasonal growth lifecycle, helping support carbon credit verification.
Register Your FieldTrack temperature, humidity, wind, and rain probability customized specifically to your field coordinates.
Track growing degree days and diurnal temperature ranges.
Monitor vapor pressure deficits driving crop transpiration.
Real-time speed and direction to define safe spraying windows.
Hourly rain depth forecasts to plan sowing and harvesting.
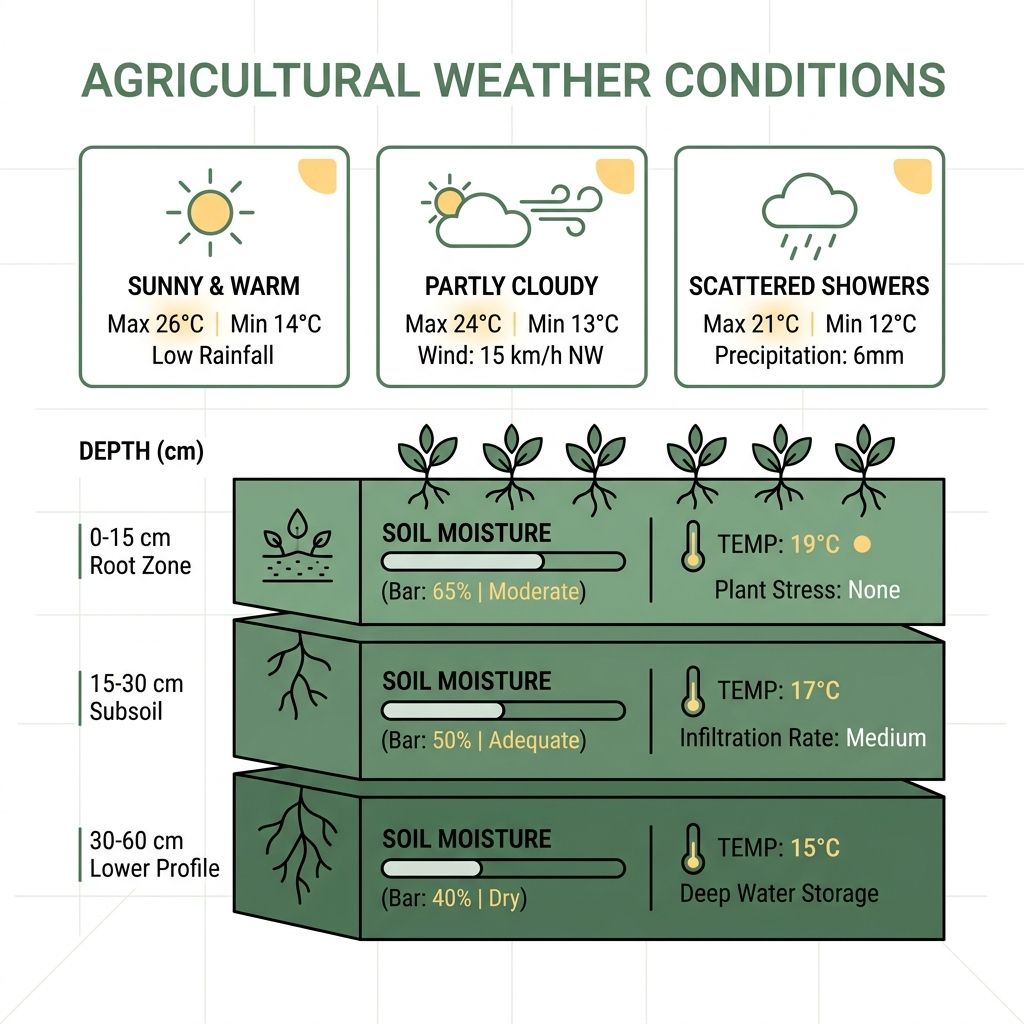
Track thermal conditions and moisture availability across three distinct underground depth zones to optimize planting depth and sowing timing.
Critical for seedbed preparation, seedling emergence, and preventing soil crusting.
Primary water absorption layer where crop transpiration extraction is driven.
Sub-surface reserve zone acting as a moisture buffer during dry spells.
Determine exact reference crop water requirements and schedule activities based on UV forecasts and wind speed profiles.
Combines solar radiation, temp, humidity, and wind to measure daily crop water loss.
Analyzes wind shear and gust patterns to prevent chemical drifting.
Calculates exact water shortage volumes in root zones for irrigation guidance.
High winds expected between 14:00 and 18:00 tomorrow. Postpone pesticide sprays to minimize drift loss. Water deficit suggests moderate irrigation.
Compare market rates across India. Search thousands of government AGMARKNET commodity records updated daily.
Identify high price fluctuations and crop value trends. Filter movements on daily, monthly, and yearly scales.
View AnalyticsSearch and look up live commodity prices instantly with state, district, mandi, and crop filters.
Explore PricesUse our farming math utilities to optimize transport margins, storage costs, and crop sowing profitability.
Perform real-time spatial price comparisons between production regions and distant terminal mandis. Factor in custom freight parameters, transit times, loading charges, and market commission rates to isolate profitable trading routes.
Assess complete farm operations profitability before seed purchase. Input seed costs, custom fertilizer regimes, tractor diesel charges, labor day-rates, and expected yield tonnage to compute exact crop break-even thresholds.
Model post-harvest warehousing options dynamically. Calculate moisture shrinkage weight loss factors, duration storage fees, interest charges, and seasonal market premium trends to identify the optimal stock release date.